Three out of four labs report persistent integration problems after LIMS deployment. The culprit is rarely the software. It's that the lab wasn't ready for it. This guide covers everything that happens before, during, and after a successful LIMS implementation: how to map and measure your processes before configuration starts, what deployment costs, and how to drive adoption and ROI long after go-live.


You bought the software, scheduled the kickoff, and told your team it's happening. Then, somewhere between configuration and go-live, things suddenly got complicated.
If this happened to you, you're not an outlier. According to the 1LIMS 2026 State of Lab Digitalization Report, a survey of 110 QA/QC laboratories, half of them in food and beverage, only 1 in 10 labs have their instruments and software fully integrated, and 2 in 3 labs running a LIMS still have integration gaps. Why?
When those labs were asked what’s blocking them, budget ranked last. The real barriers are regulatory complexity, integration difficulty, and staff resistance. Nearly all of it comes down to one thing: the lab wasn’t ready for the LIMS before it arrived.
What LIMS vendors rarely say out loud is that a LIMS only amplifies broken processes instead of fixing them. Deploy into a messy workflow, and you get a more expensive version of the same problem.
At 1LIMS, we’ve implemented lab digitalization across food & beverage, automotive, and chemical industries, and the pattern is consistent. The labs that get the most out of their LIMS are the ones that did the work before deployment. They measured their processes, defined their KPIs, and understood what they were automating and why.
This guide covers every stage from preparing your lab before deployment, through implementation, to making sure the investment pays off.

Most labs start LIMS implementation by asking, "Which system should we buy?" The better question is: "Are we ready for any system at all?"
Here’s how to make sure your QC processes are ready for LIMS adoption.
Start by walking the floor. Map every major workflow: order intake, sample registration, testing, reporting, sign-off, as it actually runs. Note where data is created, where it gets transferred manually, and where it quietly disappears. Pay special attention to the Excel files nobody mentions in meetings but everyone relies on to get through the day.
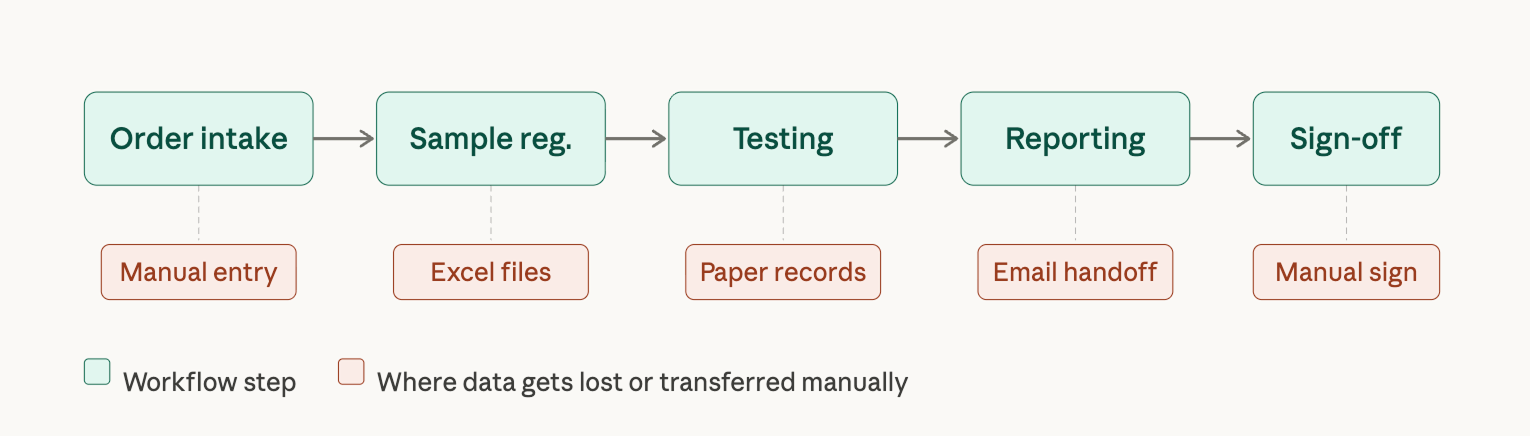
A LIMS configured around an accurate process map will fit your lab from day one.
You can't hit a number you've never tracked. Establish your baselines before deployment begins:
These numbers do two things: they give you a realistic ROI baseline to measure against after go-live, and they make the business case concrete enough for finance to evaluate.
Scope creep is one of the most reliable ways to blow a LIMS budget. Every additional module, extra integration, and custom report template adds time and cost.
Before selecting a platform, write down exactly which processes go into the LIMS on day one and which ones can wait. Decide which integrations are non-negotiable at launch and which can come in phase two. The simpler the initial scope, the faster and more predictable the go-live will be.
Here’s what it may look like:
Scope checklist example
Data migration is the most common budget surprise in LIMS implementation. If your lab has years of test results, method parameters, and sample records living in spreadsheets or legacy systems, migration requires cleaning, format mapping, validation, and import. The messier the source data, the longer it takes.
Do this before the deployment starts:
This is pre-deployment work, not something to discover mid-implementation.
Staff resistance is one of the top three barriers to lab digitalization in our 2026 State of Lab Digitalization Report, well ahead of budget, which ranks last. That resistance is rarely about the system itself, but rather about sudden change, which includes unfamiliar workflows, fear of making mistakes, uncertainty about whether the new process will actually be better.
The fix is early involvement. Bring key lab staff into the assessment phase before any configuration decisions are made. Let them identify the pain points and flag what isn't working. When people help define the problem, they're far more invested in the solution.
Here’s what pre-deployment looks like in practice when you do it with 1LIMS.
Frifag Märwil AG is a Swiss poultry producer managing everything from animal feeding to final delivery. Before committing to LIMS implementation, they commissioned a LabCheck workshop with 1LIMS to assess whether digitalization would pay off and what it would take.
What the assessment found: one full-time QA employee was spending 32% of their working time on quality data management, equivalent to CHF 22,400 in annual costs. Lab staff overall were spending 55% of their time managing data rather than acting on it. The workflows were fragmented: data moved from paper to Excel to email, introducing manual steps, delays, and a high risk of errors at every handoff.
With that baseline established, 1LIMS calculated the impact of digitalization: reducing QA data management from 32% to 10% of a full-time employee's workload, saving up to CHF 15,400 per year, with a projected ROI of 71%.
Those numbers came before a single workflow was configured. That's why pre-deployment measurements are so important: they give you confidence grounded in data.
Now for deployment: what to do at each stage, and what it will cost.
Once your processes are mapped, your KPIs are baseline, and your data is clean, you're ready to deploy. This is where most labs get surprised because they didn't understand what they were pricing in the first place.
A LIMS budget has two parts: a one-time implementation cost and an ongoing subscription. First-year totals range from €10,000–€15,000 for small labs to €40,000–€50,000+ for large or complex ones, depending on users, workflow complexity, integrations, and data migration scope. For the full breakdown by lab size, see our LIMS implementation cost guide.
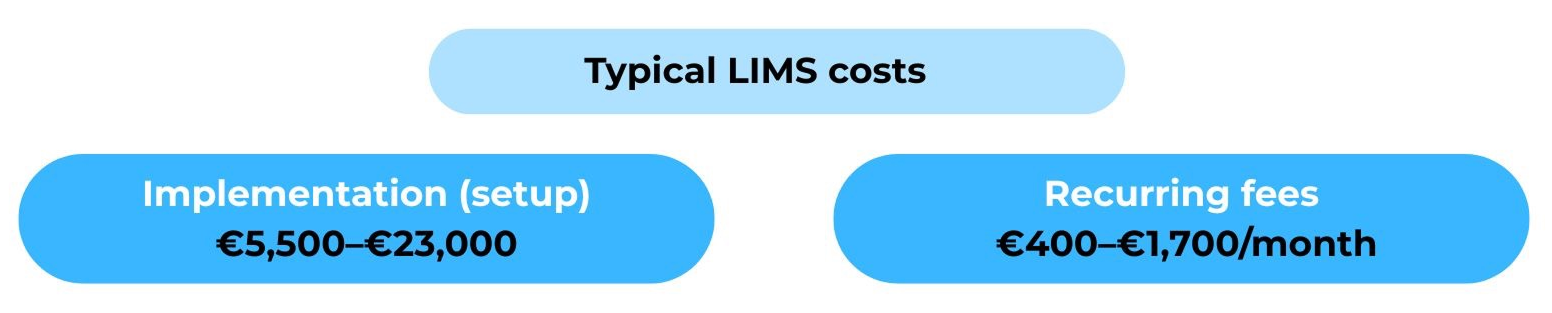
Two line items catch most labs off guard. Data migration is the big one; its true scope only becomes clear once someone actually looks at the data, which is why the pre-deployment audit in Step 4 isn’t optional. The second is change management: the labs that stall mid-implementation almost always stall because of people, not software. Budget for the time your team needs to adjust, not just for setup.

Configuration is where the system gets shaped to your lab: user roles, permissions, test plans, master data, report templates, and workflow logic. Done well, it produces a system that feels like it was built for your team. Done poorly, it produces a tool that nobody uses.
Two things decide which one you get. The first is scope discipline. Every addition mid-project adds configuration time and moves the go-live date. At 1LIMS, the scope is agreed upon and documented before configuration starts, and changes go through a formal process. That keeps the timeline intact.
The second is having an internal point of contact. Assign someone on your team who is available throughout configuration: reviewing setups, answering questions, catching mismatches. Labs that go quiet during configuration and check back in at week three almost always find that the system reflects the vendor's interpretation of their requirements, not the lab's actual reality.
Migration is not a background task. It requires active involvement from your team at every stage:
The most reliable approach is to treat migration as a parallel workstream with its own owner. Labs that hand migration entirely to the vendor and assume it will work out tend to discover problems at go-live.
Instruments, ERPs, external service labs, invoicing systems — everything should be connected, configured, and tested before go-live.
Integration problems discovered after go-live create workflow gaps that your team has to patch manually while the system is live. That's the scenario a proper integration phase is designed to prevent.
TTest data flow end-to-end, not just connectivity. Results need to arrive in the right field, in the right unit, mapped to the right sample, and that only gets confirmed by running real test data through the connection.
UAT is the last checkpoint before go-live. Most labs treat it as a box to tick, but that’s a risky approach.
Here’s a checklist on how to do it so you get no surprises later on:
Training on a generic LIMS demo and training on your configured system are not the same thing. At 1LIMS, training happens on your configured instance — your workflows, your test plans, your data. It covers standard daily tasks and the scenarios your team hits when something doesn’t go to plan: a failed result, a missing parameter, an instrument that won’t respond. That’s what makes it useful from day one.
Go-live should be a defined event. Pick a date, communicate it, and on that date the old system stops being the primary record and the new one starts.
The temptation to run both systems in parallel is understandable, but it creates the ambiguity that undermines adoption. If the old Excel sheet is still there and still updated, someone will keep using it, and the new system will always feel optional.
That said, have a fallback plan for the first week. We don’t mean having a parallel system, but a documented escalation path. Who do you call if something breaks? What’s the process for flagging an issue in the first 48 hours? A good vendor has a go-live support protocol; confirm what yours looks like before launch day. With 1LIMS, most labs go live within one month.
Launching the system is not the finish line. For most labs, the first weeks after go-live are the most critical. The configuration is done, the data is in, and the team is trained. What happens next determines whether the investment pays off.
Every go-live has a rough first week. Workflows that worked perfectly in UAT feel different in real life. Someone can't find the function they need. A result comes in from an instrument in an unexpected format. A report doesn't look quite right.
None of this means the implementation failed. It means the system is live and real work is happening in it. The difference between labs that get through this phase smoothly and labs that don't is almost always the same thing: access to fast support.
The 1LIMS team stays available during and post-launch to fix issues, answer questions, and provide custom 1LIMS training. Issues flagged early get fixed quickly, but those that get worked around instead become much harder to fix later.
This is where pre-deployment KPIs pay off. Six to eight weeks after go-live, go back to the numbers you established before deployment began: data entry time per role, sample turnaround, compliance findings, and documentation workload. Compare them to what you're seeing now.
This does two things. First, it tells you whether the system is delivering the ROI you projected (and if not, where the gap is). Second, it gives you something concrete to show leadership: not a general sense that things are better, but a before-and-after figure that makes the investment legible.
The most reliable early warning sign that adoption is slipping is when people are still updating the old spreadsheet. Muscle memory is faster and more convenient than the learning curve.
The fix is not to delete the spreadsheet but to make the LIMS the path of least resistance as quickly as possible. That means making sure the most common daily tasks are genuinely faster in the system than outside it. If they're not, find out why and fix it. A LIMS that is technically correct but operationally inconvenient will always lose to Excel in the short term.
One pattern that shows up in our 2026 State of Lab Digitalization Report: labs at the manual stage have no expertise gap, but labs that are partially automated discover one. The transition to a digital system reveals a skill requirement that didn't exist before: someone who can configure workflows, adjust test plans, and troubleshoot integrations without calling the vendor every time.
That person needs to be identified and developed deliberately. At 1LIMS, we train administrators specifically so the lab can handle routine adjustments independently. The goal is a system your team owns, not one they're permanently dependent on us to maintain.
Once the system is stable and your team is confident, the desire to add everything that got deferred to phase two appears: the extra integrations, more modules, the report formats that didn't make the initial scope. Resist doing it all at once. Each addition is a mini-implementation that needs scoping, configuration, testing, and training. Labs that scale successfully treat phase two with the same discipline they brought to phase one: define what's going in, measure the baseline, and validate before going live.
Twelve months after go-live, the question is whether the lab is measurably better. Lower error rates. Faster turnaround. Cleaner audits. A QA team spending more time on analysis and less on documentation.
Those outcomes don't happen automatically when the LIMS goes live. They happen when the preparation was done properly, the deployment was managed carefully, and the post-go-live period was treated correctly. That's what successful LIMS deployment looks like. Not always a smooth launch, but a lab that looks different twelve months later.

A LIMS is only as good as the lab it's deployed into. The software simply reflects whatever structure already exists. That’s why labs that see measurable results twelve months later are the ones that were prepared properly.
If you want to see exactly how 1LIMS would work for your lab, the fastest way is a live demo with our team. We'll walk you through the platform on a real lab setup, answer your questions, and give you a picture of what deployment would look like for your workflows.

Privacy is important to us, so you have the option of disabling certain types of storage that may not be necessary for the basic functioning of the website. Blocking categories may impact your experience on the website. More information